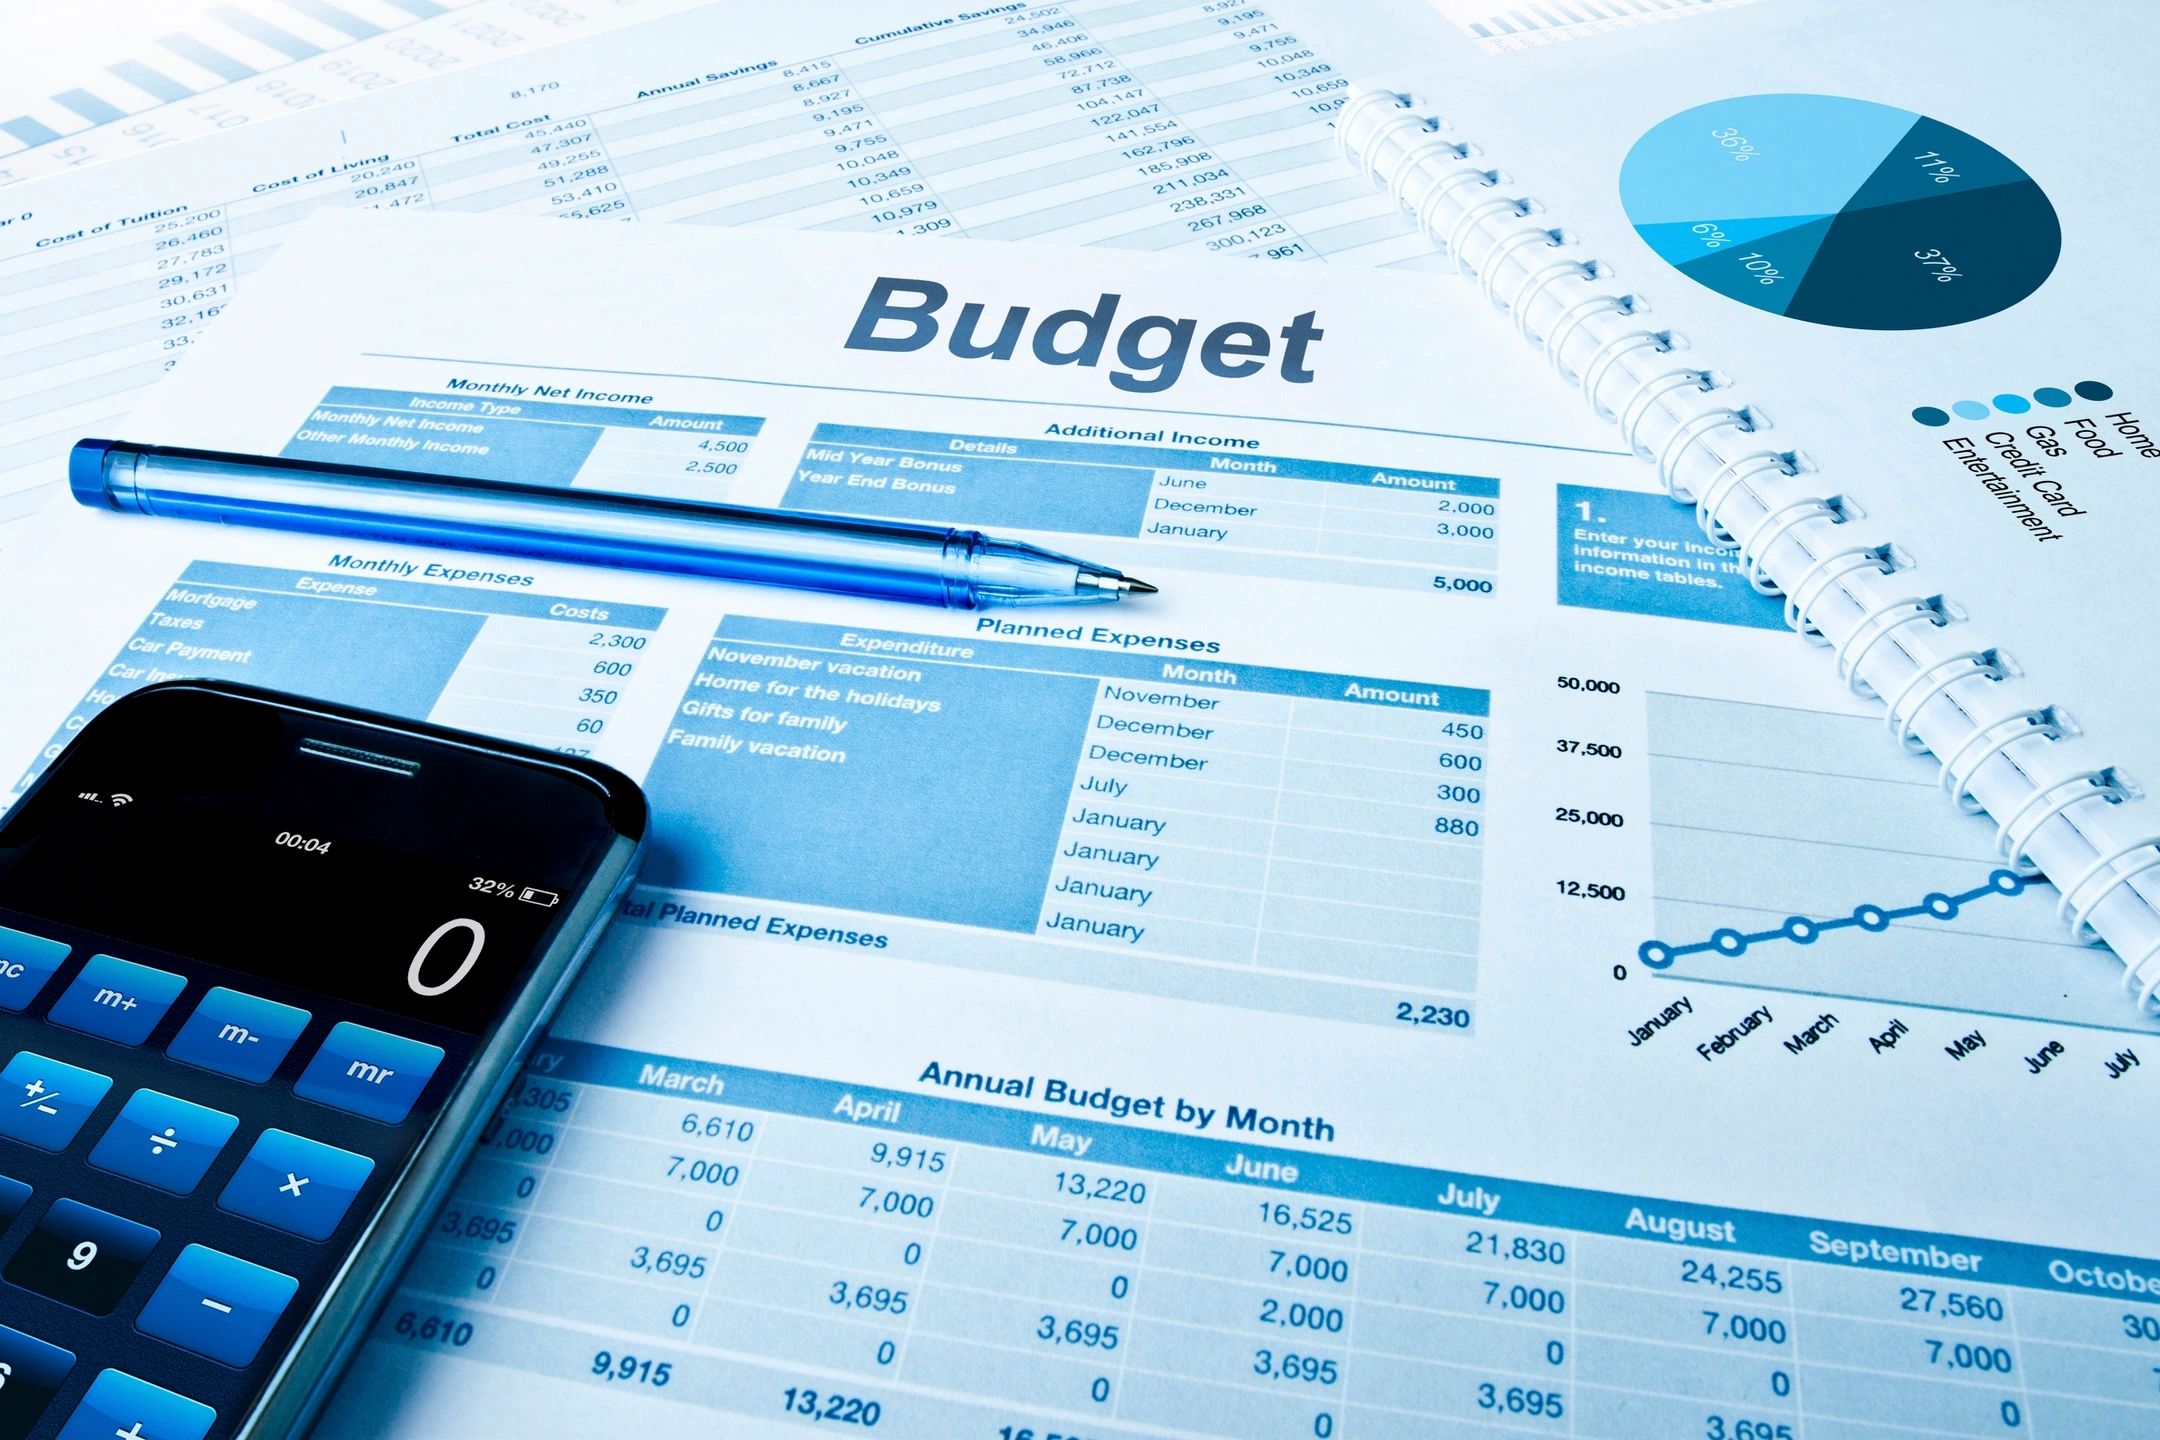
Since 2013, I have started tracking my financials. It has been 8 years now and I must congratulate myself for being quite discipline doing so regularly.
My “Finance Management Excel file” includes monthly data of income, expenses, stocks bought/sold, realised profits/losses, assets owned, insurances, my total portfolio, and ultimately my net worth yoy.
In the following article, you will find screenshots of excel sheets (tabs) as my personal accountant. I have intentionally hide the $value. Still, you will be able to see the overall format and structure. Hopefully it is helpful for readers.
MONTHLY INCOME / EXPENSES
“IE21” tab shows my monthly income and expenses for year 2021, and IE20 year 2020, so on and so forth. There will be fixed income (e.g. salary) or fixed expenses (e.g. your monthly mortgage, netflix charges, hair cut etc.).

The variable expenses or income are captured daily using “Notes App” in my mobile phone not shown here. For e.g. if I pay say $10 for a personal meal, I will write “Food personal $10”. Or when I fill up my Car’s tank, I will record as “Petrol $100”. Extra variable income for the month, I will also type in my mobile notes too. During month end, I will then sum up and transfer all variable income / expenses recorded from my mobile to the excel sheet shown below.
Taking the sum of total income subtract total expenses, net Cashflow each month is known.
ASSET / EQUITY VALUE
“EQ21” tab – shows my total asset/equity value each year 2021. Here is where I updated data of buy/sell stocks, bonds, precious metals, crypto etc. The cash in my bank accounts, SRS, or physical cash, CDAs as well as any liabilities (except for house or car loans) are recorded as well.

Then pie charts will be created to see the composition of my Total Portfolio consisting of Cash – liquid bonds such as SSB, stocks, precious metals and crypto.
Net Property value, Car, CPF, insurances, jewelries etc are excluded in this sheet. They will be included in the Networth excel sheet.
STOCK PORTFOLIO
The “Stock Port” tab shows my stock Portfolio. This sheet is derived from my latest “EQ” sheet to see specifically my Stock composition. You can see that I am “heavy” on “Tech-Green” sectors at the moment.

PROFIT & LOSSES
“P&L” tab is the sheet where I track all the realised profits/losses of stocks sold as well as the dividends earned every year. And then there will also be columns “purple ones” showing the total earnings so far.

INCOME STATEMENT
“C.I.S” tab is my consolidated income statement to compare year-over-year figures.

NET WORTH
The table below will then consolidate total values from the different sheets that I have shown earlier to sum up my eventual net worth for the year.

FINALLY, my net worth bar chart from 2013 to 2021 fc.

Note that I have normalised my net worth here based on year 2013 as 100%, to see yoy growth. The actuals are for “my eyes only” is not shown here.
SUMMARY
Needless to say, you do require quite a fair bit of effort and discipline each month with all the recording. That said, the effort is worth it. They provide good data for me to track, budget, and manage my finances better.
It is by no means my intention to be boastful, though I am happy that my net worth has increase more than 400% over the last 7-8 years. Respectfully, I am sure there are many others who have witnessed even higher growth. Perhaps even 4000% or more growth in net worth in the same period.
What I am trying to EMPHASIZE is that without “diligent” or “insightful” or “lucky” INVESTMENT of any kind or PROPER FINANCIAL MANAGEMENT, it is not possible to see a decent uptrend in your net worth. There are exceptions. Unless you strike it big with your own business, or you are at the top of corporate ladder. It is DEFINITELY NOT possible also, if you are just an average employee who is a saver of monthly salary!
Above all, you can be the biggest miser and save in everything of your life, but if you don’t grow your top line, it is futile!


Respect Rolf! We know that discipline and perseverance isn’t easy – not just in the tracking but the actual efforts to manage our investments for more than 400% increase!
Hi Kev,
Thanks for the compliments. Over the years, your comments always so positive and encouraging. Likewise your blog articles. https://www.turtleinvestor.net/
Our latest articles are centred around budgeting and financial tracking. Haha… what a coincidence. I remember this was not the first time it happened. GMTA!
Wow…. your webpage is really packed with substance and it is so nicely done up. The organisation, the display, the clarity in writings…..
https://www.turtleinvestor.net/store/
I meant every words, no sugarcoating!
i really admire your diligence and attention to details in recording everything down ! it is def not easy!
alot of self discipline!
400% inc over 8 years…. wow.. thats just amazing! congrats!
BroFC,
Thanks for the kind words. The 400% is quite mediocre compare to many. Guess too conservative at the back of engineering education.